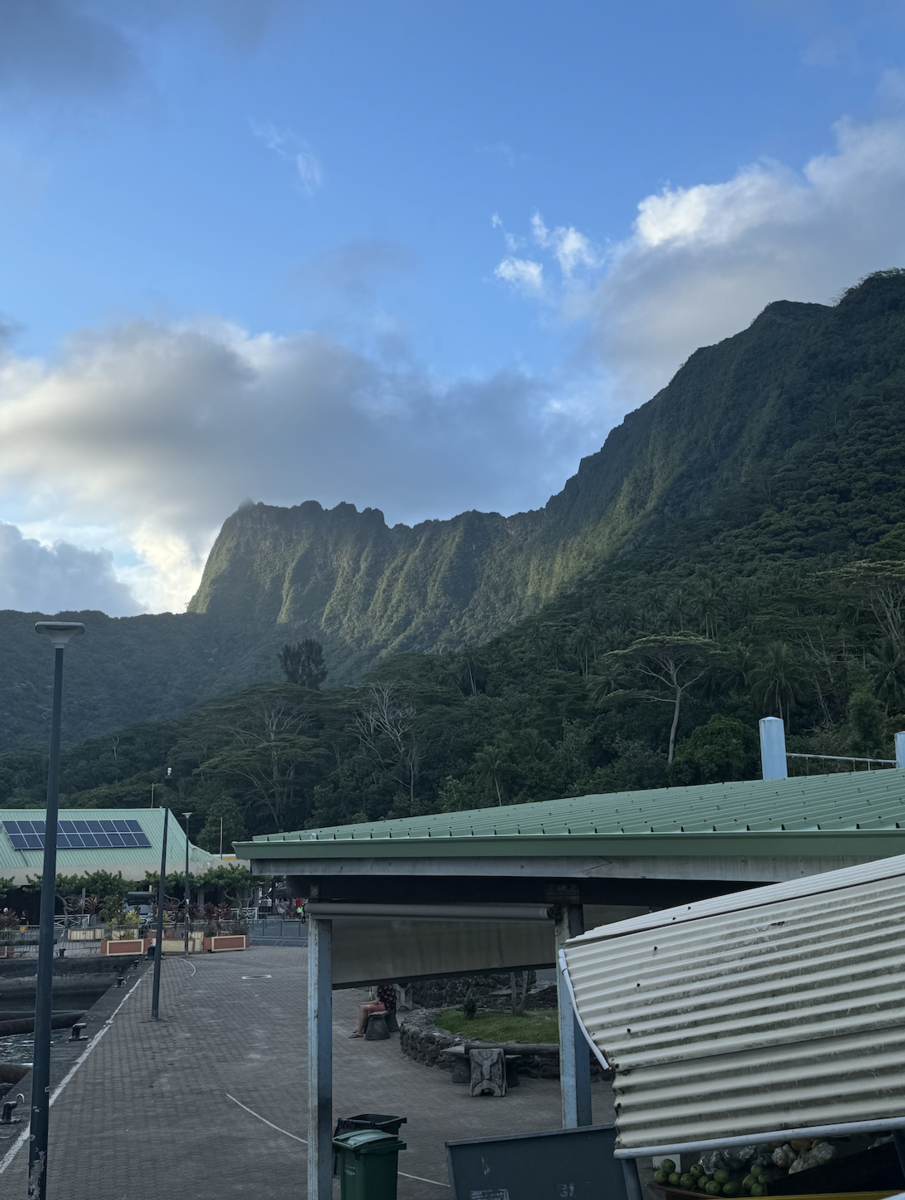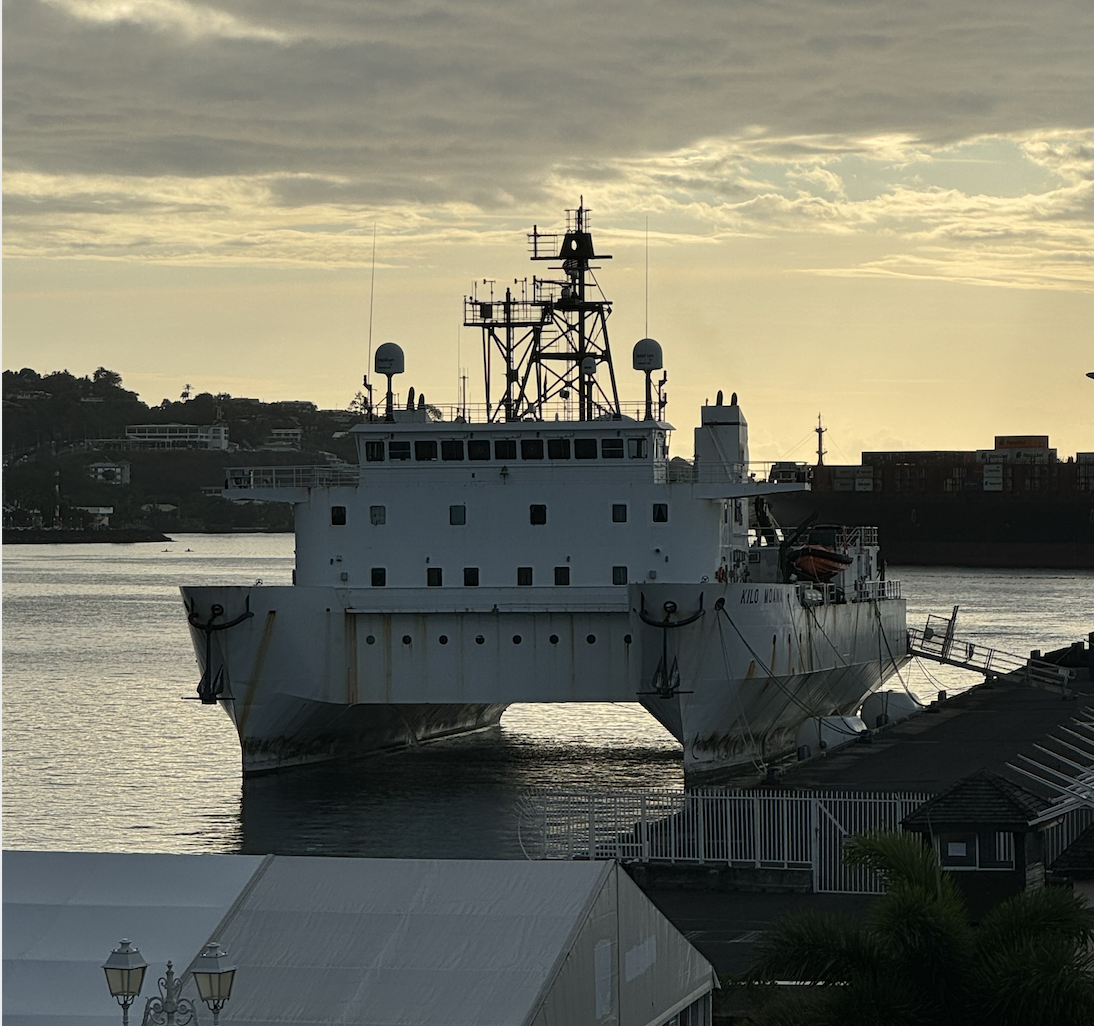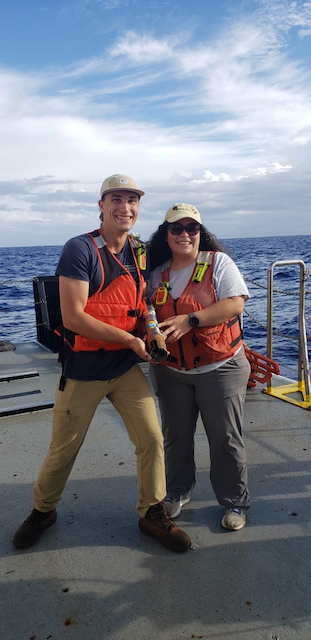
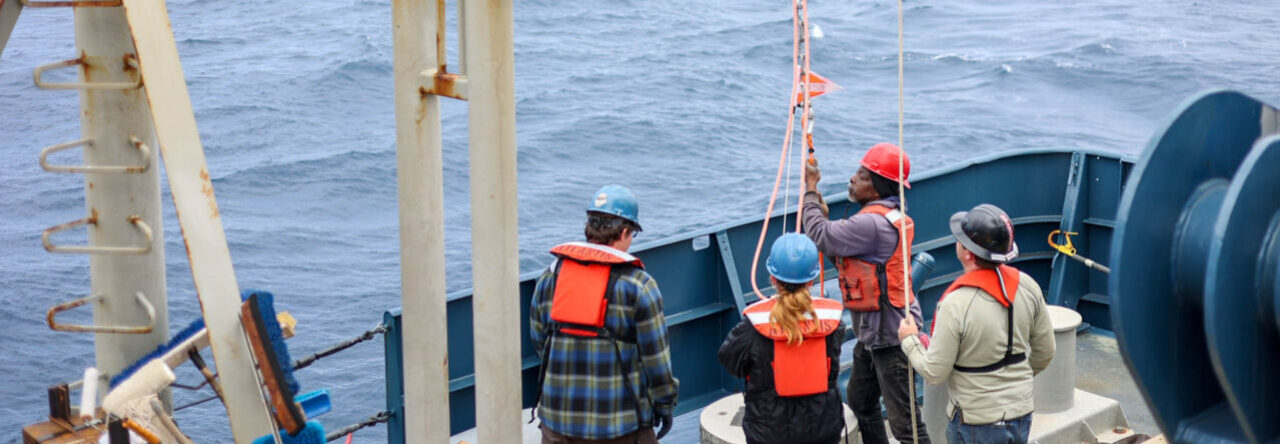
On Monday we took an official tour of all the spaces in the CMORE building associated with the HOT team. We had been introduced to the spaces we were using so far but it was cool to see the full picture!
Unfortunately due to an allergic reaction I was out for part of Monday and Tuesday, but by Wednesday I was feeling ready to jump back in!
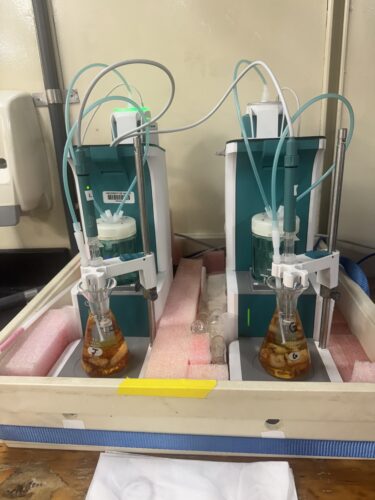
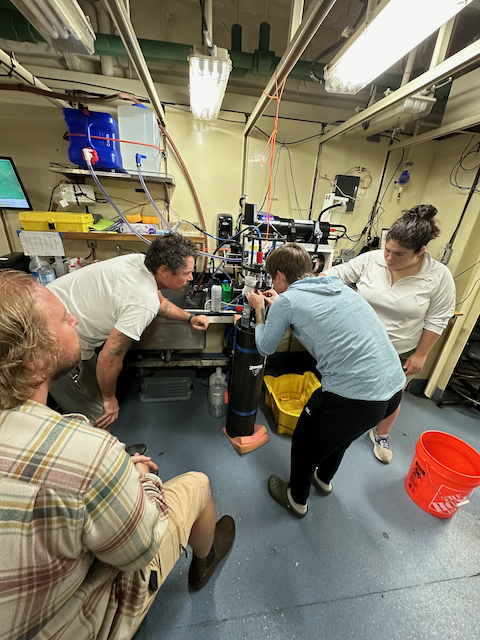
On Wednesday I learned how the HOT team determines the total dissolved inorganic carbon (DIC) in seawater samples. They use a machine called a Single Operator Multi-parameter Metabolic
Analyzer, or SOMMA. Dan Sadler walked us through each step that the SOMMA uses, and I practiced running samples.
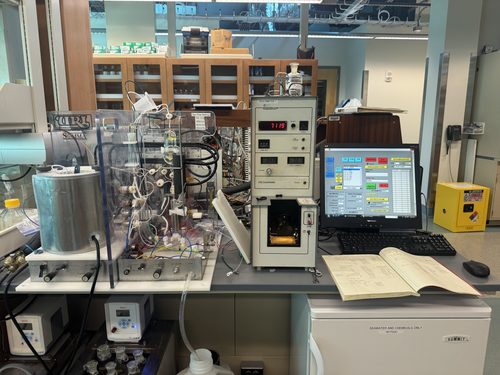
First, water samples are placed in a water bath to achieve a constant temperature. A second water bath surrounds the sample when it is connected to the SOMMA for processing. The SOMMA begins the analysis process by rinsing the interior plumbing twice with sample, then pumps a set volume of sample into a secondary flask, also surrounded by a water bath. The SOMMA uses an open circuit and the conductivity of seawater to determine when each chamber is sufficiently filled.
The set volume of sample then moves on to the ‘stripping chamber’, where it is reacted with phosphoric acid. This change in pH shifts the chemical equilibrium so that all DIC in the sample is in the form of CO2. In the same chamber in the SOMMA, carbon dioxide free air bubbles through a frit to carry CO2 derived from the sample on to the next processing step without any seawater or acid.
The CO2 derived from the sample moves through a condenser that removes water vapor by chilling the sample, then passing it through a column of magnesium perchlorate. Then, the gas moves on to the coulometer cell.
In the coulometer cell, the CO2 derived from the sample is returned to solution by reacting with an absorbent containing ethanolamine. As CO2 enters the coulometer cell, it acidifies the solution( producing H+), causing a blue indicator dye to fade to clear. A beam of light passes through the solution, and when the transmission of light begins to increase, the machine understands that CO2 is being added and starts to titrate.
The machine titrates by adding a measurable number of electrons to the coulometer cell. An electric current is applied to a silver anode submerged in an anode solution, attached as an ‘arm’ alongside the larger cathode chamber of the coulometer cell where the sample is deposited. The anode and cathode chambers are separated by a frit that allows electrons to pass through, so when more electrons are added to the anode chamber, the concentrations balance and more electrons are added to the cathode chamber as well. When the SOMMA detects CO2 in the coulometer cell and starts to titrate, it keeps a ‘count’ that directly corresponds to the number of electrons added, based on the time interval, current and voltage.
When electrons move into the cathode chamber, they react with water, producing hydrogen (H2) and hydroxide (OH-), a base that neutralizes the H+ created by introducing CO2 from the sample. This neutralization is reflected by the indicator dye, which becomes darker in color. When the transmission of light drops to 29%, the machine stops adding electrons and waits. The SOMMA records counts every minute, but since CO2 continuously moves into the coulometer during the analysis process, it doesn’t stop titrating until the count is below baseline for four consecutive minutes. When the count is at or below baseline, this means that no more CO2 is being introduced to the sample because all of the CO2 has already been ‘used up’, neutralized, and accounted for.
Finally, we can account for the number of counts included in the background rate (about 5 counts for minute with the HOT team’s current SOMMA) by multiplying the background rate by the time required for analysis, which can vary for each sample. Then, we can subtract this from the total counts and calculate the corresponding number of electrons needed to neutralize all of the CO2. Since the ratio of H+ to OH- is one to one, this also tells us the moles of CO2 present in each sample.
We already know that the SOMMA uses a fixed volume at a specific temperature, so with the moles of CO2 in the final step we can calculate the concentration of DIC per kilogram of seawater.
All of these reactions happen internally within the SOMMA, and proceed automatically after inserting the sample and starting the analysis process on the associated computer. It’s an incredible instrument and I was so excited to learn how it works!
The SOMMA only uses a small portion of each water sample for its analysis: so the remaining water is titrated to determine alkalinity. The HOT team collects enough water to redo either the SOMMA analysis or the alkalinity titration, in case any problems arise during analysis.
In the afternoon, I met with Dr. Fanny Girard, a professor studying deep sea corals. My undergraduate research focused on habitat mapping at a methane seep, and I’m also interested in deep sea ecology, so I was excited to talk in person! She was able to help me identify the family of some black corals that I had observed at my study site (Pythia’s Oasis) and show me some beautiful corals of her own from her latest cruise.
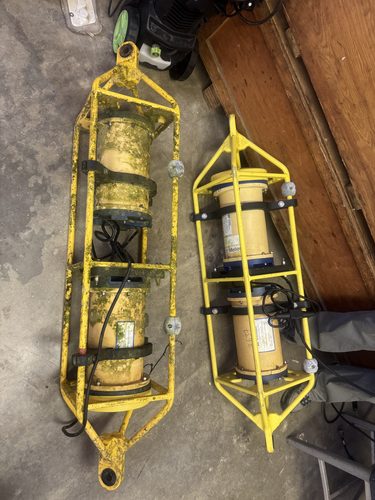
On Thursday, we went to work with Dan Fitzgerald and saw his lab at the Marine Sciences Building. He had recently returned from a WHOTS cruise where a mooring was recovered, so he had some ADCPs and mini-CATs with new data to download! ADCPs, or acoustic doppler profilers, measure current speed throughout the water column by interpreting the reflectance of acoustic pings off of particles moving with the water.
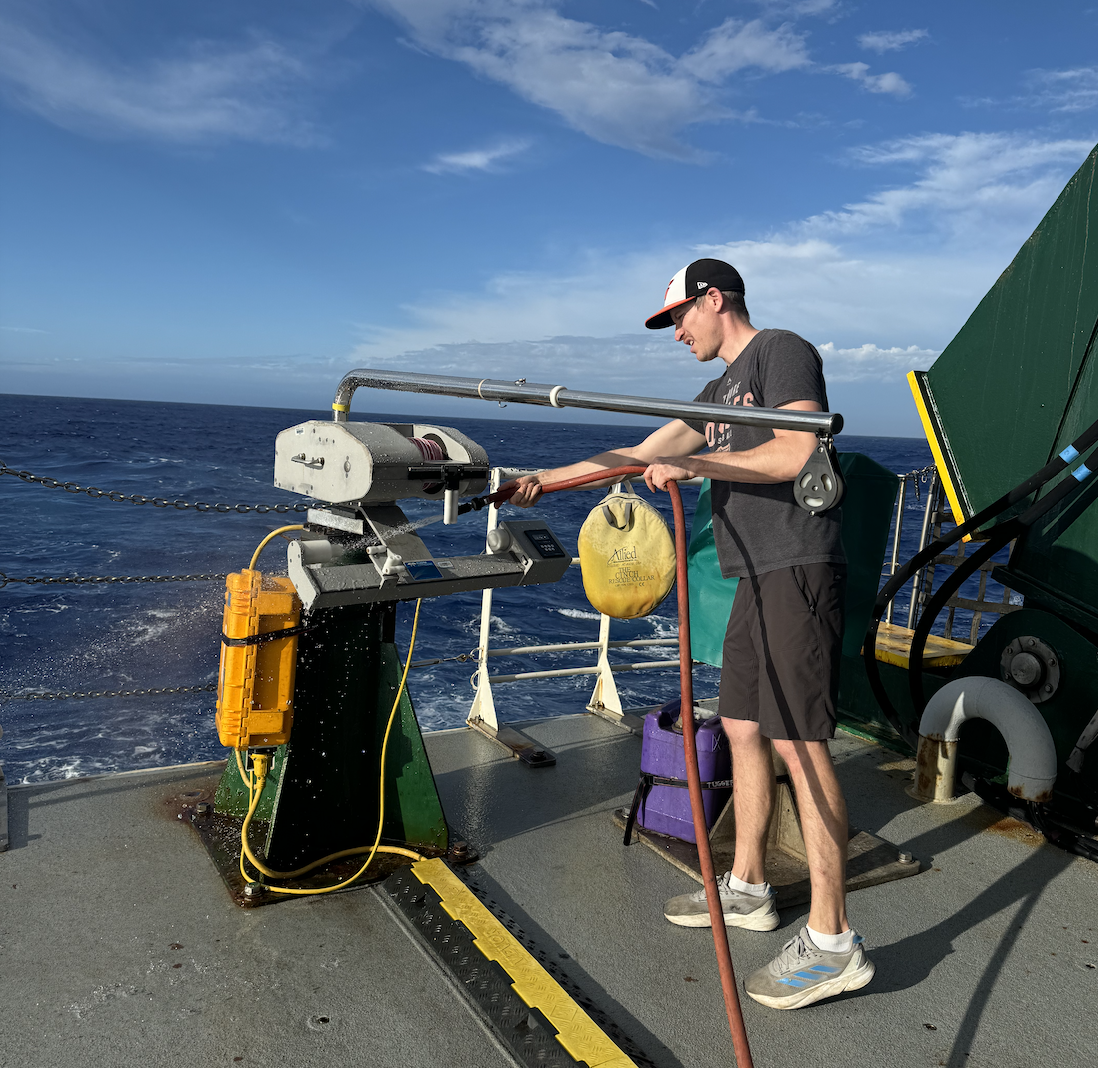
Mini-CATS measure conductivity (salinity) and temperature. We pressure washed the instruments to clean off biofouling before carrying them up to the office.
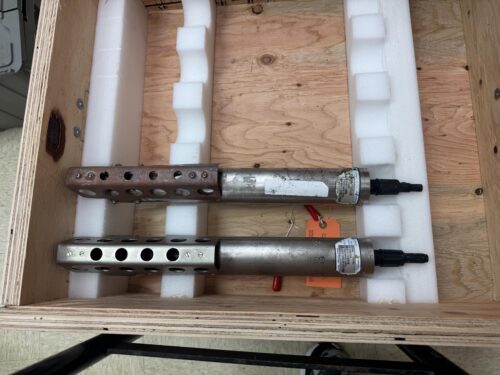
Dan uses a variety of cables to establish direct communication with each instrument, run commands, and download data, depending on the generation of each instrument. He gave us an introduction to serial communications and gave us some tips on navigating and troubleshooting. I got to ask lots of questions about ADCPs and take them apart to access the data! We learned that mooring ADCPs have additional considerations compared to shipboard ADCPs, since you can’t use a ship’s heading, and moorings can spin and tilt in the current. Instead, WHOTS ADCPs have a magnetic compass and tilt sensors. The magnetic fields around the battery packs, which are created in-house, can interfere with the compass – so Dan taught us that it’s important to degauss our instruments.
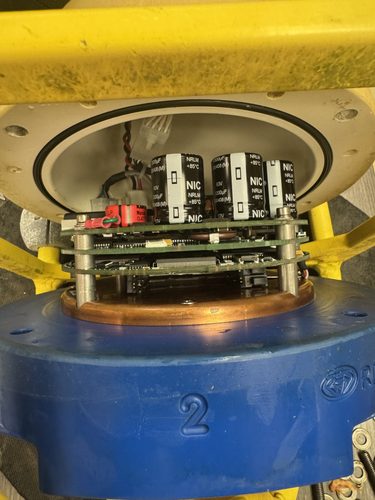
That afternoon, I had the chance to meet with Dr. Julia M. Hummon and Dr. Eric Firing, who lead shipboard ADCP management in the UNOLS fleet and beyond. They reach out to ships if they notice problems with any of their ADCPs, guide troubleshooting, and oversee installation, as well as leading workshops and processing ADCP data for their clients. They had some great insights about the skills and qualities necessary to be successful in their field.
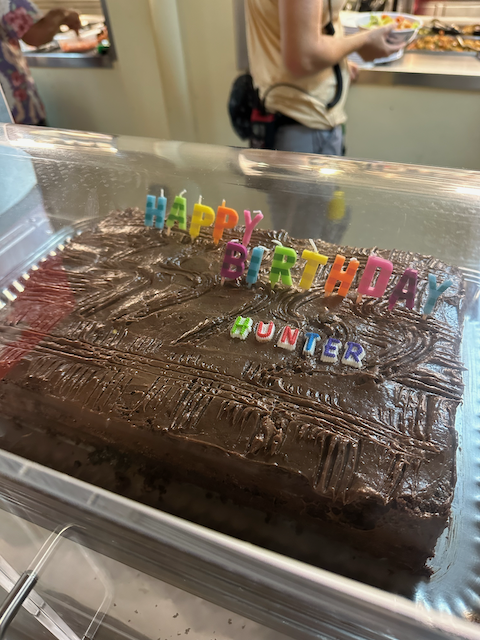
On Friday, I traveled back down to the beach lab to work with Hunter Adams, a SUBSEAS technician. The SUBSEAS program focuses on understanding the cycling of organic carbon between the surface ocean and the mesopelagic. This program works closely with the HOT team and will be joining us on our next cruise!
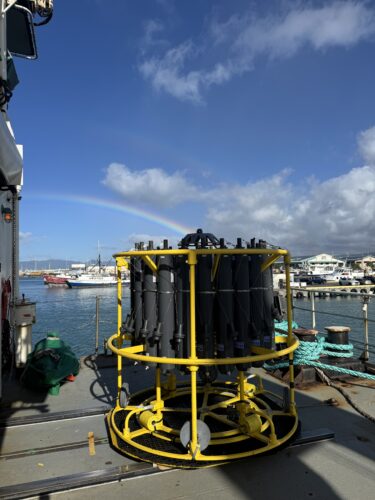
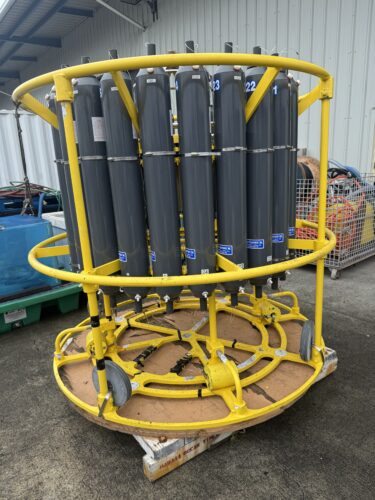
While working with Hunter we learned how to replace hardware on a trace metal CTD rosette, and got an introduction to some of SUBSEAS’ other instruments.
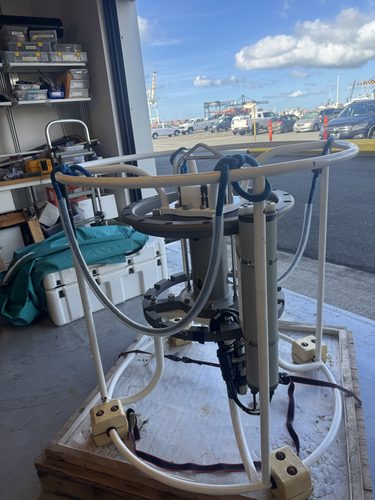
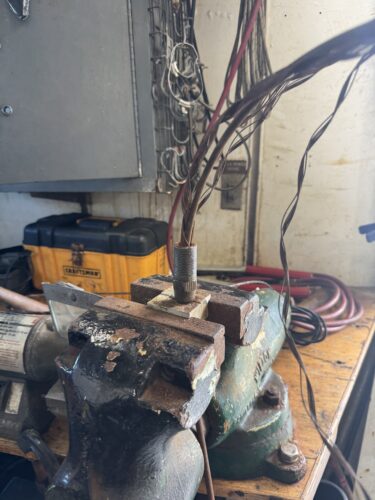
We saw the WireWalker, a profiler that uses wave energy to ‘climb’ down its own tether to record data across the water column, and Hunter demonstrated how to talk to the instrument using serial communications. He gave us some advice for troubleshooting and walked us through testing the connection for each pin on a cable when interfacing between multiple instruments. WireWalker uses a CTD logger in combination with other instruments, so proper communication and programming is especially important for this profiler.
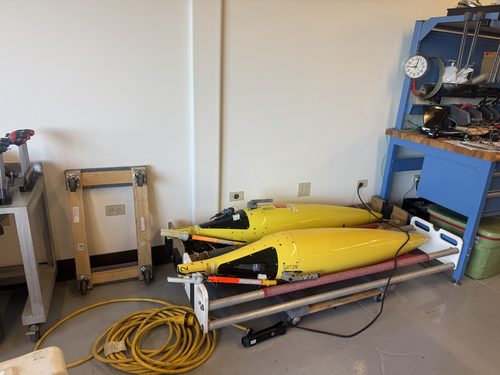
Though SUBSEAS’ Seaglider was all boxed up, there were some other Seagliders in the lab! Hunter talked us through their basic mechanics and deployment process. SUBSEAS’ Seagliders have a CTD, fluorometer, dissolved oxygen, and a fragile shear sensor that makes deployment and recovery a delicate operation!
Finally, we bench tested a Vertical Microstructure Profiler, an instrument that measures small differences in shear. We blocked off the instrument in a faraday cage of tinfoil connected to ground, turned off the lights, and avoided moving around the room while the instrument ran. The sensors operated as expected once we had blocked out background electrical noise, so they should be ready to go for their next use case.
All in all, I had an amazing week continuing to learn and meet new people!

 Bubble Troubles: Week #9 12/02/2024 – 12/09/2024
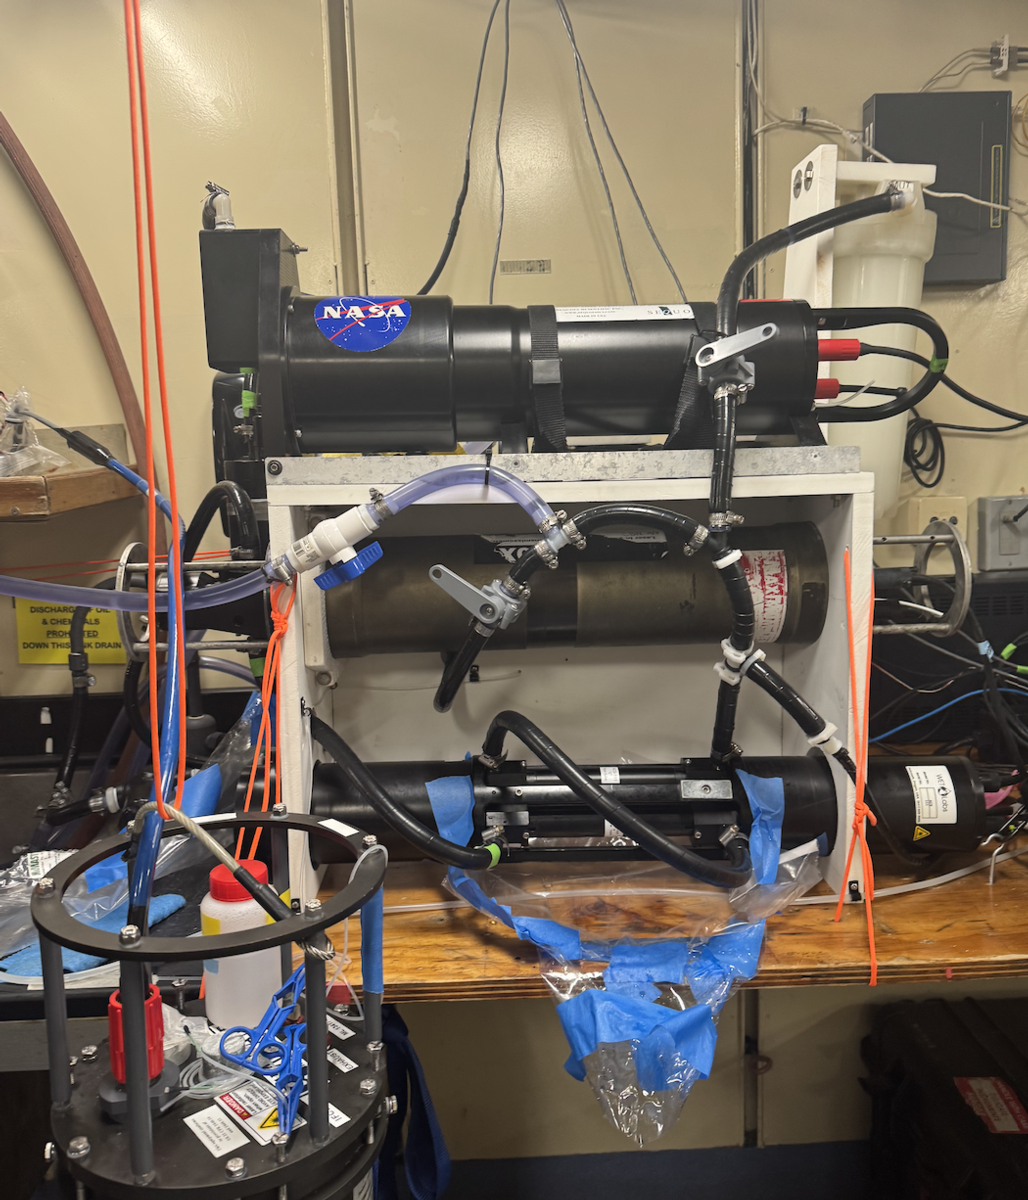
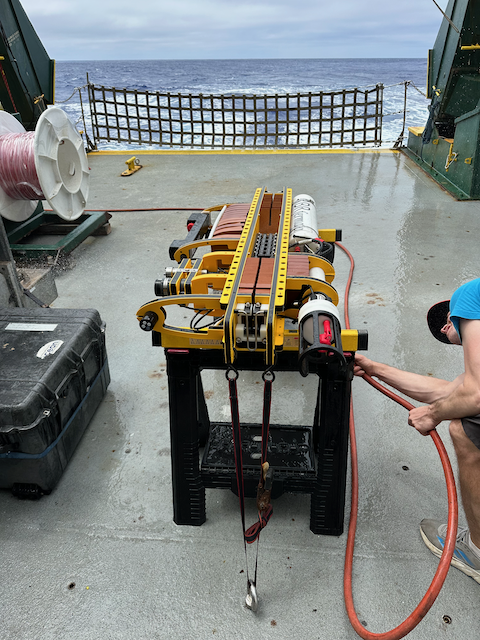
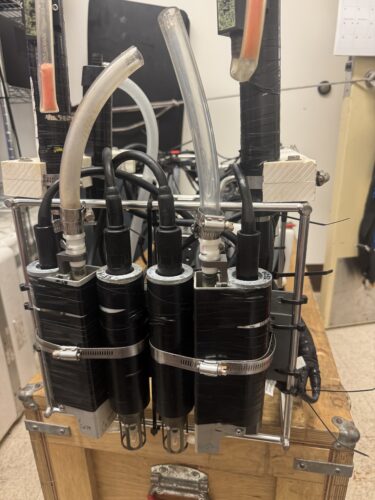
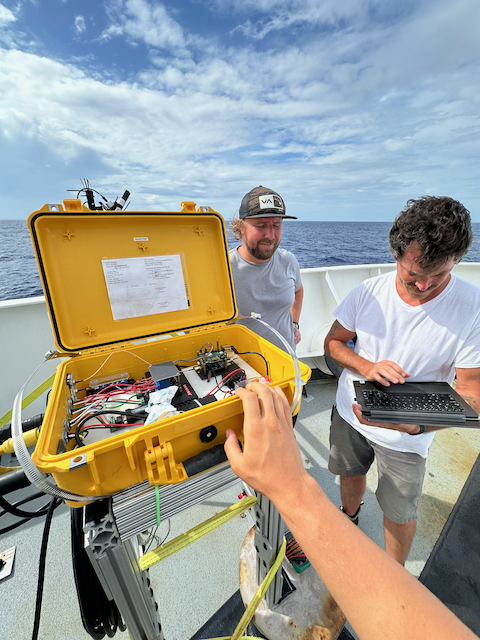
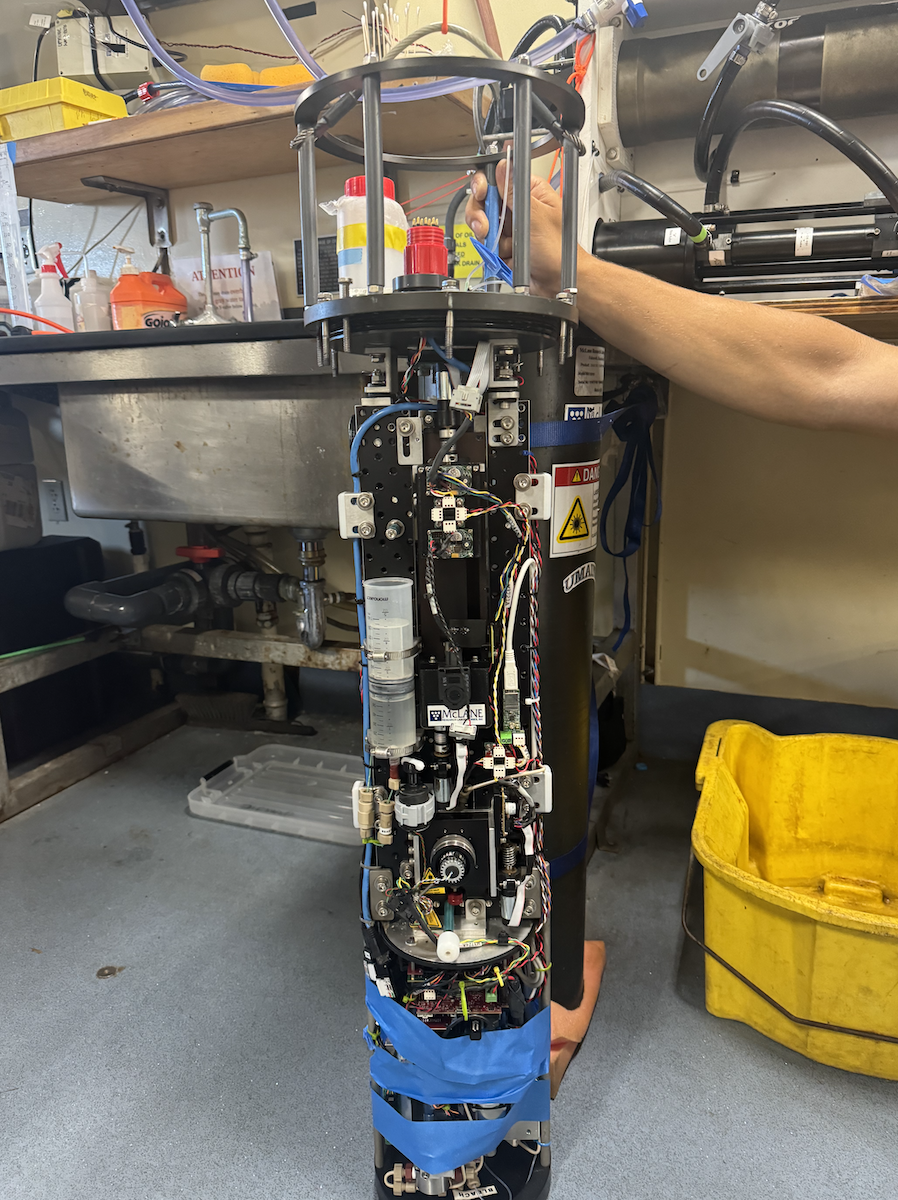 – IFCB outside of its Titanium Case