
The BATSVAL cruise is a yearly cruise that covers a transect of 15 stations between Bermuda and Puerto Rico. Each station involves at least a CTD casts to 20 m above the bottom, and 24 niskin bottle samples. Some also included plankton tows, or McLane filter pump deployments. Since the stations are about 6 hours or more apart, and the CTD casts take 3 or 4 hours, we normally only did 1 or 2 per day. This makes for a pretty slow cruise, but efficient and well prepared deployments.
During the ample down time, I made a point to continue working on Arduino projects and practicing knots that I learned from last week. Each of the Marine Techs have also been teaching me about the various data logging systems aboard the ship. I also continued the cable inventory and organizing from previous weeks.
There were three larger projects I spent the rest of the time working on: calibrating the flowmeters for the underway sampling systems, inspecting and testing backup CTD pumps, and creating quality control plots for the meteorological sensors.
Calibrating the flowmeters reminds me of the lab procedures I did in a Water Resources Engineering class. With one of the other Marine Techs, we controlled the flow to different rates with the valve, and did multiple time trials to fill a vessel. Then, we can use the timetables in combination with the raw Hertz reading that is sent to the data logger to create a calibration curve that relates Hertz to mL.
Inspecting and testing the CTD back up pumps was my favorite project as I was able to take apart the entire assembly and check out the circuit board that controls the pump motor. I was able to see the things I have been learning about with the Arduino board in use. The pumps used on the CTD are actually pretty simple and involve a similar program to one of the Arduino projects to power a rotor that spins a magnet. The magnet then spins an impeller that sucks in water through the pump head. I also inspected the o rings and re-lubricated each pump.
The final project I spent some time working on was to use the data logger built in software to create real-time plots that allow data from duplicate sensors to be compared. For example, I created a plot that displays data from the anemometers on each mast, so that we can compare in real time if one may be different from the other when it shouldn’t be. I also discovered that the humidity sensor on one of the masts is not working correctly, and collected a sample of data comparing it to the working sensor, so that it can be sent in to the manufacturer for troubleshooting.
We arrived to Puerto Rico this afternoon, ahead of schedule. It is great to have a bit of a break between cruises, and to visit San Juan for the second time. The ship is scheduled to depart on Saturday, with some extra sampling planned for the way back to fill in between stations.
Cheers to be in Puerto Rico!
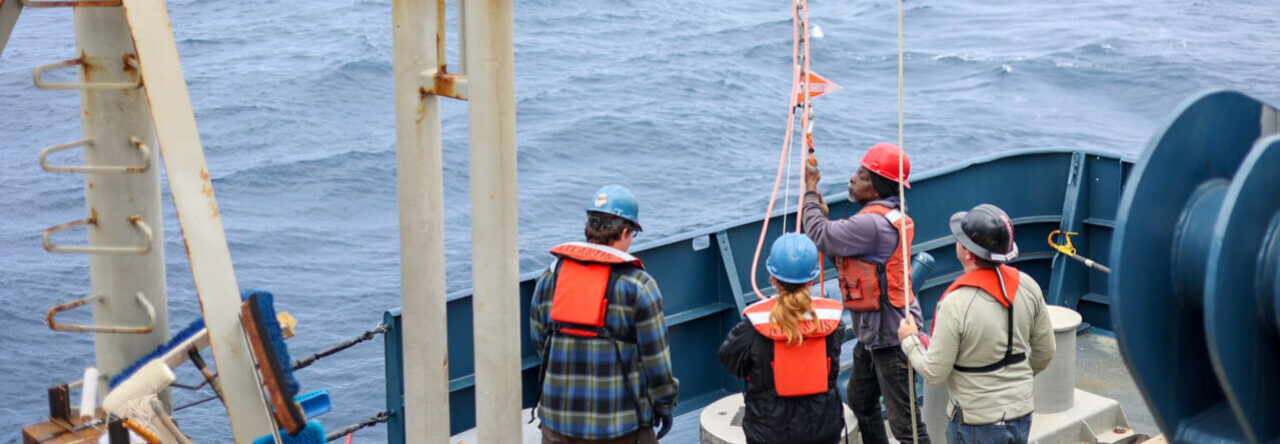
Deploying the CTD for a deep bottom cast:

The disassembled Seabird 5T pump:

Inspecting the electronics:

Castillo San Feliple del Morro guarding the entrance to San Juan’s port:
